8 Ways GIS Helps Predict and Prevent Tsunami Disasters
On December 26, 2004, a massive earthquake struck beneath the Indian Ocean and sent a wall of water nearly 100 feet high outward. It barreled into South Asia at 30 miles an hour, wiping out communities before most people even knew what was coming.
By the time the waves crossed the ocean, nearly 230,000 lives had been lost, making it one of the deadliest disasters in modern history.
We can’t stop tsunamis from forming. But today, we’re far better prepared. Thanks to GIS technology, scientists can spot danger sooner, issue faster warnings, and save more lives. Let’s look at eight ways GIS technology makes that possible.
What Are Tsunamis?
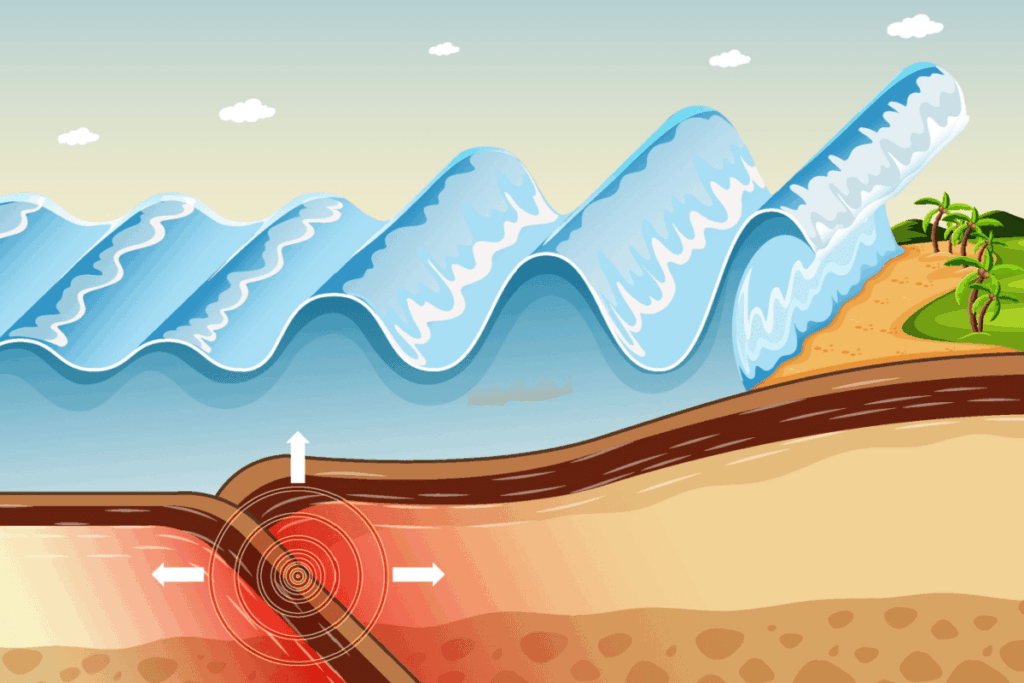
Tsunami means “harbor wave” in Japanese, but it’s not an ordinary ocean wave. A tsunami is an entire water column—from the seafloor to the surface—that moves at speeds up to 500 miles an hour. (That’s as fast as a commercial jetliner.)
Tsunamis are triggered by sudden, large-scale disturbances in the ocean, like:
Undersea earthquakes
Volcanic eruptions
Underwater or coastal landslides
Tsunamis are dangerously deceptive. If you’re at sea, you may only feel a slight bump or dip as the monster passes beneath. But as a tsunami approaches shallower waters, it slows down, grows taller, and becomes a destructive surge.
Can Tsunamis Be Predicted?
While tsunami prevention is impossible, tsunami prediction has greatly improved in the last two decades. Before GIS technology, early tsunami prediction systems centered on the Pacific Ocean. In other areas of the world, technology and resources were limited, and predictions were often crude and uncertain.
A survivor of 2004’s Indian Ocean tsunami later described hearing what sounded like roaring thunder. It was so loud that hotel staff and guests thought a plane had crashed offshore. Moments later, a dark wall of water came rushing in.
How GIS Improves Tsunami Prediction and Preparedness
Think of GIS as the brains behind tsunami preparedness. It can’t stop earthquakes, but it buys time, saves lives, and helps communities make critical decisions long before waves reach shore.
Let’s explore eight ways GIS protects coastal communities from tsunamis.
1. Integrating Early-Warning Systems
After the 2004 Indian Ocean disaster, scientists used GIS to connect several separate monitoring systems into a powerful,real-time tsunami warning system. These included:
Seismic networks
Ocean buoys
Tide gauges
Coastal sensors
When a major earthquake occurs, GIS quickly determines whether a tsunami is likely and which coastlines are at risk. This critical information makes rapid alerts and evacuations possible.
In 2011, a massive tsunami struck Japan. While the losses were devastating, Japan’s GIS-based early warning system helped reduce impacts and has continued to improve since.
2. Identifying Who’s Most at Risk—and Where
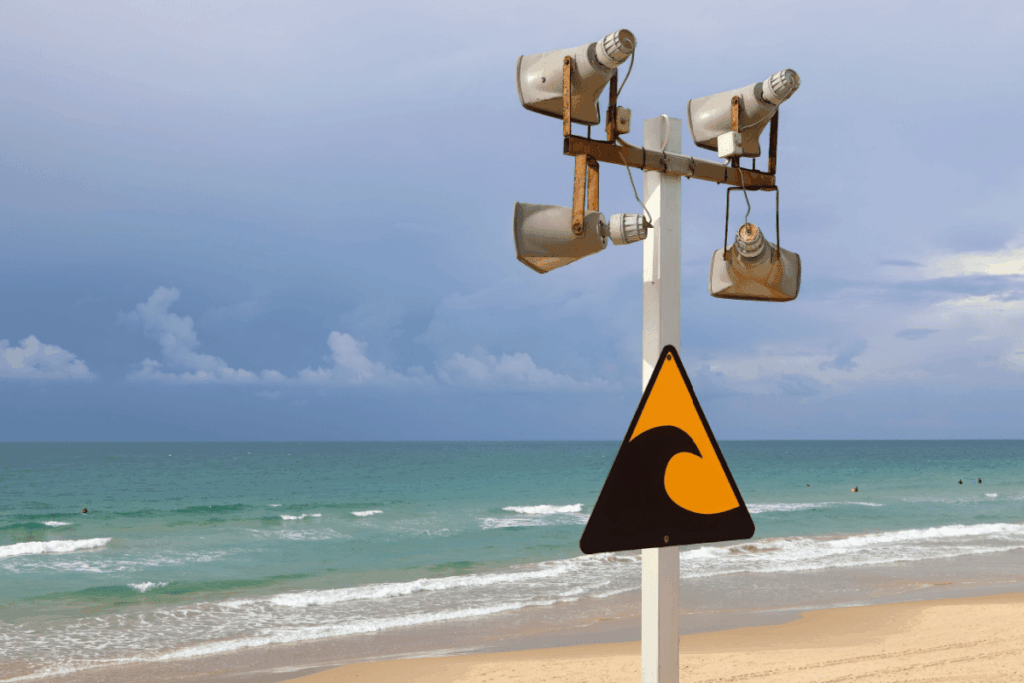
Japan’s tsunami warning siren has a nickname: the “5 p.m. chime,” because it gets tested every weekday at five in the afternoon. Like the American Emergency Alert System, Japan’s siren is crucial both for real scenarios and for educating vulnerable populations.
GIS technology helps scientists layer population data and determine tsunami flood zones. The government then prioritizes siren coverage and evacuation planning for vulnerable areas.
3. Real-Time Mapping for Emergency Response
What happens when a tsunami is confirmed? GIS-powered emergency warning centers get updates in near-real time, displaying:
Warning zones
Predicted arrival times
Estimated wave heights
Incoming damage reports
Real-time mapping systems help officials coordinate evacuations, close transportation corridors and deploy emergency crews while the first wave is still en route.
4. Modeling “What If?” Tsunami Scenarios
How are tsunamis predicted? Scientists at NOAA’s Center for Tsunami Research pre-compute thousands of tsunami scenarios—including different earthquake sizes, locations, and fault movements—and store them in GIS. This allows them to run models and predict potential impacts before disaster strikes.
Determine where hillside shelters or vertical evacuation towers are needed
This planning can mean the difference between life and death when every second counts.
6. Planning Safer Coastlines
Ever heard of “the Big One”? A giant fault line running from California to British Columbia could rupture and cause a massive tsunami. The U.S. Pacific Northwest is planning urban projects with this worst-case scenario in mind.
This includes:
Avoiding building in the most dangerous zones
Strengthening critical infrastructure that must stay near the coast
Updating zoning rules and building standards
7. Making Maps Public and Accessible
Accessibility can save lives. Scientists use GIS to turn data into simple visuals for citizens. For example, if you’re in Hawaii or Alaska, you can use a tsunami evacuation map to know your zone, where to go, and how to get there quickly.
These maps are used in school programs and evacuation drills, so community members are equipped with a clear plan before a warning siren ever sounds.
8. Partnering GIS With AI Algorithms
Can AI predict tsunamis? Not in advance … yet. Earthquakes happen too suddenly. But AI is already used in GIS-powered systems like the U.S. Geological Survey’s ShakeAlert and the Japan Meteorological Agency’s warning system. These systems quickly classify earthquakes, helping improve GIS-based hazard models.
Key Takeaways
Need a recap? Here’s what we know about using GIS in tsunami-prone areas:
GIS technology can’t stop tsunamis, but it buys time and saves lives.
Integrated data enables faster warnings and evacuations.
Real-time maps guide emergency response.
Scenario modeling improves preparedness.
Population and public maps reduce confusion.
AI enhances forecasting as a supplement to physical models.
Want to Be on the Front Lines of Disaster Prediction?
Our fully online, career-focused program helps you apply your interest in extreme events to real-world challenges across fields such as:
Disaster preparedness
Biology and environmental science
Law enforcement
Sociology
Social media
The future belongs to people who can see patterns before they unfold. See what UTPB’s GIS and Geospatial Graduate Certificate is all about and where it can take you next.
Modern video games can recreate the real world with stunning precision, and GIS technology is what makes that possible. In fact, when fire ravaged Notre-Dame Cathedral in Paris in 2019, a detailed digital model built for the video game “Assassin’s Creed Unity” surfaced as a potential reconstruction reference. GIS is rapidly reshaping what it means to play video games today. This article examines: What Is GIS? …
Imagine you’re commuting to work and your Google Maps loses signal. Suddenly, the little blue dot stops moving and you don’t know where you are. Panic ensues (for some of us). Modern devices constantly broadcast our location through GPS, Wi-Fi, cell towers, and apps. We’re basically walking beacons of sensitive data. But here’s the flip side:…
Flu season is here again, with all its aches, pains, and fevers. But scientists have a powerful tool to fight back. The GPS technology used to plot your rush-hour route home? It also powers GIS (Geosciences Information System) tools that help public health officials pinpoint infectious disease outbreaks, limit their spread, and spot gaps in…